1405 Using the Loan Pipeline Report with Excel
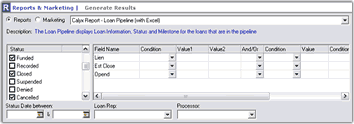
Generating the Calyx Report - Loan Pipeline (with Excel):
- Open Point.
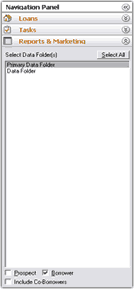
- From the Navigation Panel, select Reports & Marketing.
- In the Select Data Folder(s) section, highlight the folders that contain the files needed to generate the report.
- Select Prospect, Borrower, or Include Co-borrowers.

![]()
Note: You must select more than one status if you want to view an accurate pie chart generated from the report.
7. Click Generate.
Understanding the Loan Pipeline (with Excel) report results:
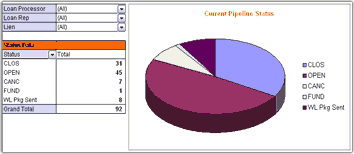
The Loan Pipeline (with Excel) report generates a pie chart and table for the amount of loans per loan officer and processor. Only loans that meet the status requirements selected from the Status section will generate for this report.
You can toggle between the different report panels by selecting the appropriate buttons on top of the report view screen.
Pipeline Status - Displays a pie chart for the amount of loans by status, and a table for the amount of loans per loan processor and loan representative.

Detail Status - Displays all results generated by the report.
![]()